Bitcoin’s market cap has entered a new stress level as the unrealized losses have reached 19% of the total market cap at a price of around $68,000. According to the data provided by Glassnode, the current drawdown pattern is similar to that of May 2022. On the other hand, market analysts on social media platforms …
Bitcoin’s market cap has entered a new stress level as the unrealized losses have reached 19% of the total market cap at a price of around $68,000. According to the data provided by Glassnode, the current drawdown pattern is similar to that of May 2022. On the other hand, market analysts on social media platforms have also pointed out the increasing stress on the total market cap of the crypto market. A post on X was based on the on-chain data.
On-Chain Data Shows Bitcoin Market Cap Under Stress
Glassnode’s Relative Unrealized Loss indicates the percentage of Bitcoin market cap that is currently at a loss. The current value for this indicator is 19%, which is seen during intense selling pressure. This indicator shows the coins that are currently below the cost at which they were purchased.
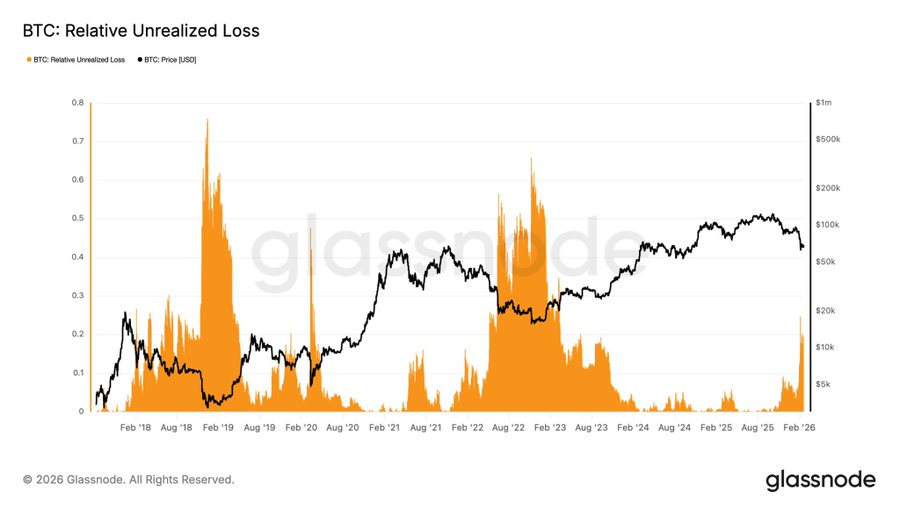
The above graph indicates the previous instances of unrealized losses during intense market corrections. Such instances were witnessed in 2018 and in May 2022. During such times, the price of Bitcoin dropped significantly, and a substantial portion of the supply went underwater. The current setup is following a similar trend as the price drops from the highs.
Social Media Reaction to Bitcoin Market Cap Decline
Coin Bureau presented the information on X, saying that “unrealized losses now constitute almost one twentieth of Bitcoin’s market cap.” The tweet mentioned that the “current drawdown corresponds to the ‘brutal May 2022 pain structure.’” It also mentioned the stress areas that came before capitulation periods.
The tweet became popular among traders who follow on-chain data. Some traders follow unrealized loss levels to determine market positioning. High levels of unrealized losses are often associated with forced selling, margin calls, and decreased risk appetite. Nonetheless, the information itself does not indicate market direction.
Historical Context of Capitulation Phases
Historical cycles help understand the present Bitcoin market cap situation. In late 2018, unrealized losses rose as the price dipped below $4,000. The same happened in May 2022 due to systemic failures that led to market liquidations. In both instances, the stress level was high in the final stages of the protracted downturns.
The Glassnode chart illustrates that the spikes above the previous thresholds were accompanied by intense distribution phases. Following these instances, the market volatility remained high until the prices stabilized. The current market volatility of 19% is close to what was witnessed during the previous downturns.
Market Outlook as Bitcoin Market Cap Faces Volatility
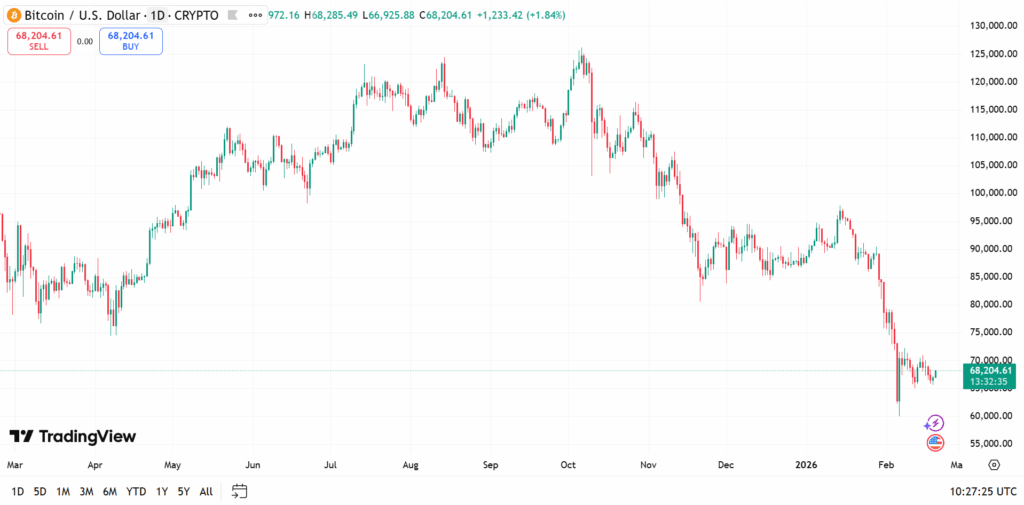
Bitcoin is trading close to $68,000 as unrealized losses continue to build up on the network. The total market cap of the crypto market is also showing signs of a less optimistic market due to the recent price corrections.
The on-chain data continues to be an important part of the current analysis. Relative Unrealized Loss is a measure of the overall stress levels of the Bitcoin market cap holders. Although past experiences have shown similar levels of stress during capitulation levels, every market cycle is different due to the changing macro environment. Currently, it shows high stress levels on the network as the price is trading below the previous peaks.
Finley Benson is a tech-savvy writer with a background in blockchain development, Finley explores the latest innovations in Web3, DeFi, and smart contract technologies. His articles blend technical depth with real-world applications.