According to information published on the web, there has been an increase in the discussion of an important on-chain metric, which has been related to the cycles in the market. Data indicates the percentage of the coins being held below the price at which they were purchased and moving towards the 40-45% range. The news …

According to information published on the web, there has been an increase in the discussion of an important on-chain metric, which has been related to the cycles in the market. Data indicates the percentage of the coins being held below the price at which they were purchased and moving towards the 40-45% range.
The news has been issued with the purpose of warning the investors that the increase in the supply of the coins being held at the loss levels usually happens during the early stages of the bearish cycles. The chart has been included with the message, which indicates the instances in which the same levels were recorded before the further corrections in the market. Data has been considered important for the investors looking for the long-term trends in the price of the cryptocurrency.
The supply in the loss refers to the percentage of the circulating Bitcoins, which are being held below the price at which the coins were last moved.
Post Points to Historical Bear Market Patterns
The post via X indicated that the supply loss for the cryptocurrency continues to fall towards the levels recorded during the earlier declines. The 40-45% range, according to the information, had been recorded during the early phases of the bear market, which had occurred during the prior market cycles.
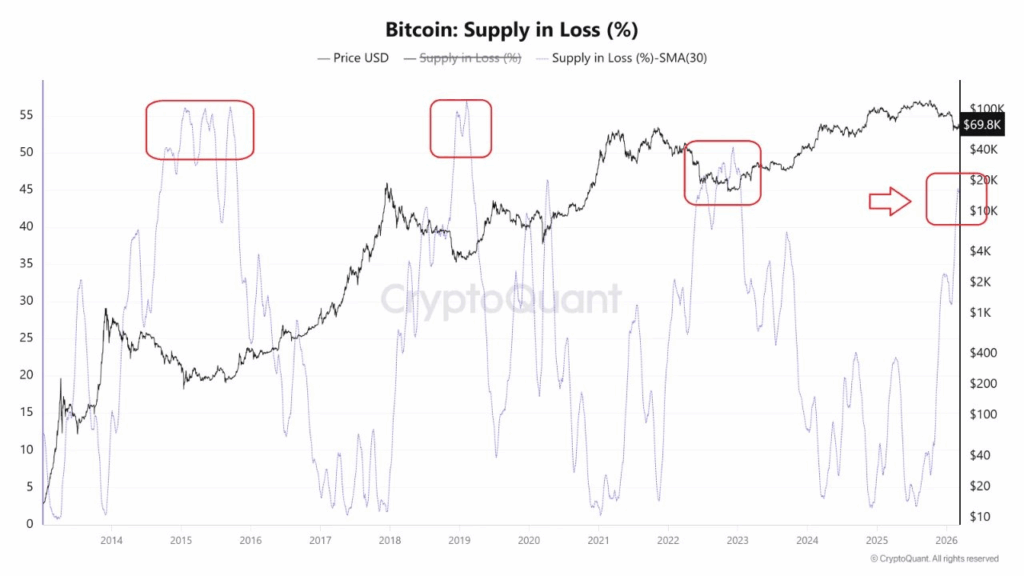
Shared chart indicated instances when the supply in loss began rising towards the 40-45% range. These instances included the phases recorded during the 2015, 2019, and 2022 market cycles. These phases followed the sharp declines or consolidation phases recorded during the cycles.
The post indicated that the prior cycle bottoms had been recorded when the metric began rising towards the 50% levels. The information suggested that the current levels are lower than the levels recorded during the capitulation phases. This information is often tracked by those monitoring the Bitcoin News.
On-Chain Data Shows Changing Market Conditions
On-chain data has shown an increase in the dotted supply-in-loss line as the price line moves sideways. This shows an increase in the number of holders who are in loss as their entry price is above the current market price.
When there is an increase in the percentage of coins in loss, market participants look at changes in the behavior of long-term holders and traders. The higher this reading is, the more holders are holding their BTC below their acquisition price.
Past cycles have shown similar readings during long-term corrections in the market. As prices fall, more and more holders are pushed into unrealized loss territory. Analysts often compare this reading with data from earlier cycles to look at patterns in Bitcoin News.
Bitcoin Price Context and Market Cycles
Further, the price movements of Bitcoin continue to dictate movements on the supply-in-loss metric. When Bitcoin trades at prices below entry points, this metric rises as more enter the loss category.
On historical charts, it is evident that there have been periods of time where supply-in-loss ratios saw rapid increases during periods of decline. Such periods were characterized by strong rallies before corrections in the cryptocurrency space.
The chart shared on X indicates that the current supply-in-loss is below what it has been during previous cycle lows. It is essential to observe whether it rises in the months to come.
Finley Benson is a tech-savvy writer with a background in blockchain development, Finley explores the latest innovations in Web3, DeFi, and smart contract technologies. His articles blend technical depth with real-world applications.