Today, the price of BTC has reached a new all-time high. For the first time in its history, it has risen above $120,000, even pushing above $122,000. However, it is necessary to be very careful, because the first signs of a possible correction are starting to appear. The excess of enthusiasm on the price of …
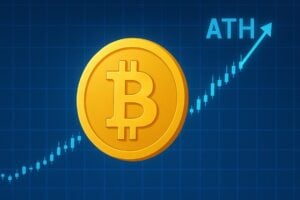
Today, the price of BTC has reached a new all-time high. For the first time in its history, it has risen above $120,000, even pushing above $122,000.
However, it is necessary to be very careful, because the first signs of a possible correction are starting to appear.
The excess of enthusiasm on the price of Bitcoin (BTC)
After the drop on Sunday, June 22, when the USA bombed Iran, the price of Bitcoin had entered a phase characterized by a slight excess of fear.
It was a very limited excess, which indeed took very little time to vanish. Emotional excesses, whether of fear or enthusiasm, always tend to vanish sooner or later, but if they are small, they tend to vanish sooner.
Already on Tuesday the 24th, the price of BTC had returned above $105,000, and the day after it had also returned above $107,000.
Wednesday, July 9, however, not only had the excess of fear completely dissipated, but an excess of enthusiasm had even been triggered.
On the other hand, markets sometimes behave emotionally, especially due to small retail speculators, and emotions can come and go in the blink of an eye.
To tell the truth, already a week before, on Wednesday, July 2nd, the price of BTC had risen above $109,000, but at that point, there were still no clear signs of an excess of bull enthusiasm.
Instead, on July 9, it suddenly shot up to $110,000, at a time when the all-time high was still $112,000. The following day it began an ascent that seems to be ongoing, which first led it to new all-time highs above $112,000, and then in the following days to also easily surpass $115,000 and then $119,000.
“`html
The problema
“`
The excess of enthusiasm is clearly highlighted by two indicators.
The first is the Fear&Greed Index of CMC, which has soared above 70 points.
The second is the RSI (Relative Strength Index) indicator, which has jumped into the overbought zone.
The Fear&Greed Index up to seven days ago was very close to the neutral zone of 50 points (0 means extreme fear, and 100 extreme greed).
Starting, however, from last Thursday, it first began to move back above the 50 mark, and then on Friday it started to approach the 70 mark.
This rise clearly indicates that in the crypto markets enthusiasm has surged, driven mainly by the new all-time highs of Bitcoin’s price.
The RSI index also entered the overbought zone on Thursday, surpassing the 70 mark for the first time since the end of May.
In fact, in the following days, it even rose above the 75 mark, indicating that the excess of enthusiasm is currently quite strong, although not yet at its peak. It is enough to remember that on May 22, when the previous all-time highs were recorded, it closed the day above 78 points, only to drop the next day even below 65.
Today it really seems that the day could end with an RSI index of the Bitcoin price once again above 78 points.
Attention to tomorrow!
Tomorrow, the data for June regarding inflation in the USA will be released to the public.
The forecasts clearly indicate a possible increase, with in particular the annualized core inflation that could rise from 2.8% in May to 3%.
The problem is that since March, the annualized core inflation in the USA has not been above 3%, even though the decline stopped already in April.
The cause is most likely attributable to Trump’s tariffs, which inevitably drive up the prices of imported products.
Until now, the tariffs had not yet impacted retail prices, but in June they apparently started to have an effect.
All this will inevitably lead the Fed to not cut interest rates at the end of July, but it will also make it decidedly difficult to cut them in September.
If the monetary policy in the USA remains restrictive for a long time, the markets could experience a small setback due to a possible further reduction in liquidity.
The influence of the dollar on the price of BTC
Starting from Wednesday, July 2, the Dollar Index began to rebound.
After hitting the lows of recent years at 96 points, that is, on the lower line of the ascending channel that has lasted for 17 years, it has bounced back up to 98 points today. At this moment, it is very close to the upper line of the descending channel that has lasted since January.
In the medium term, the trend of BTC’s price is inversely correlated to the Dollar Index, but in the short term, this correlation can momentarily break.
In fact, starting from July 2, the price of Bitcoin began to rise anomalously along with the Dollar Index, and although this is a dynamic that has already occurred countless times in the past, it is an anomaly that generally lasts only for a few weeks, before inevitably starting to revert.
However, if the Dollar Index were to start falling again, even in the event of a temporary correction in the price of Bitcoin, one might then witness a resumption of the inverse dynamic, should the decline of DXY continue well below 96 points, breaking downward through the ascending channel that has lasted for 17 years.
In other words, it is possible that from now until the end of the year there could be significant volatility again in the price of BTC.
Finley Benson is a tech-savvy writer with a background in blockchain development, Finley explores the latest innovations in Web3, DeFi, and smart contract technologies. His articles blend technical depth with real-world applications.