
Bitcoin’s latest rally just ran into a wall it built itself. The bitcoin price decline that unfolded on September 23, 2026, pushed the token below $85,000 and, more importantly, beneath the average cost basis that U.S. spot ETF buyers paid to get in — a level Bitfinex analysts had pegged at roughly $86,000 just hours …
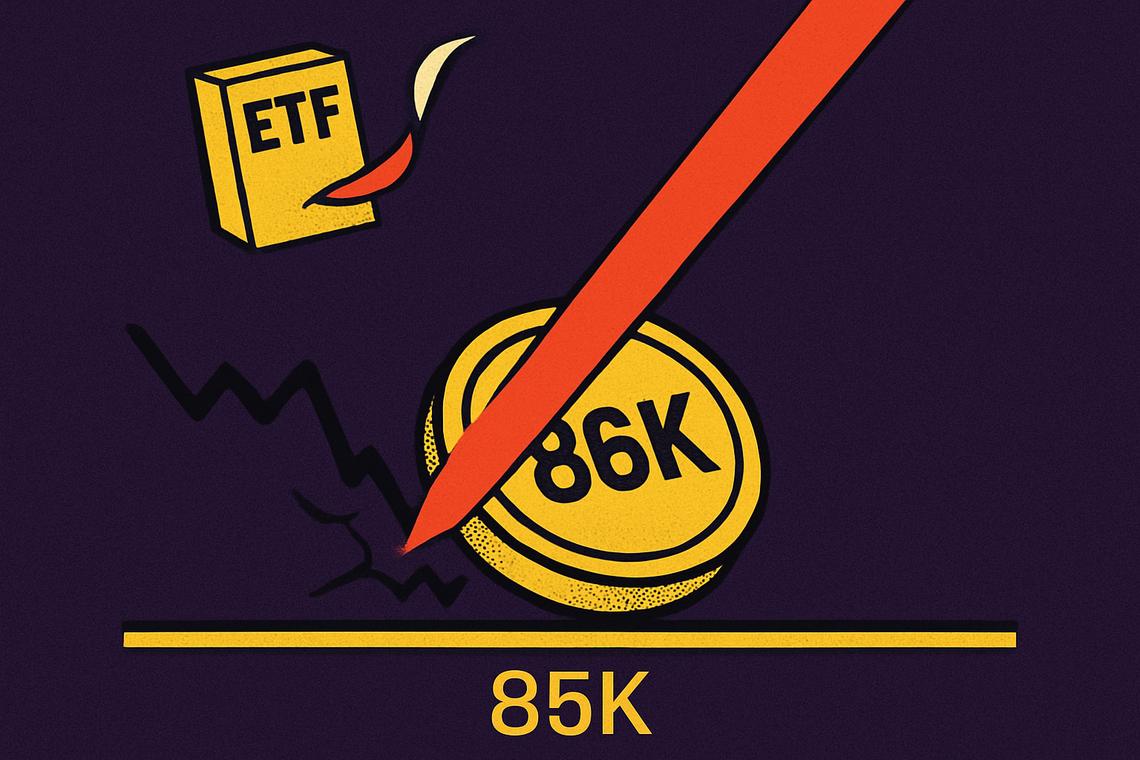

Bitcoin’s latest rally just ran into a wall it built itself. The bitcoin price decline that unfolded on September 23, 2026, pushed the token below $85,000 and, more importantly, beneath the average cost basis that U.S. spot ETF buyers paid to get in — a level Bitfinex analysts had pegged at roughly $86,000 just hours earlier. The drop wasn’t isolated. It rippled across the broader crypto market, dragged funding rates negative, and coincided with declines in U.S. stocks and gold.
Key takeaways
- Bitcoin fell below $85,000, closing 1.9% under the U.S. spot ETF average cost basis of $86,000.
- Total crypto market value dropped 2.27% to $2.96 trillion on September 23, 2026.
- U.S. spot bitcoin ETFs had just pulled in $999 million on Monday and $714.7 million on Tuesday before the reversal.
- OKX perpetual funding rates for both bitcoin and ether swaps turned negative, meaning shorts are now paying longs.
- CME Group plans to list Bitcoin Cash and Uniswap futures on October 19, pending regulatory review.
Bitcoin Price Dips Below the ETF Average Cost Basis
Bitcoin’s break below $85,000 mattered because it crossed a threshold tied directly to real buyer behavior, not just chart geometry. The token ended the U.S. session 1.9% below the $86,000 average cost basis that Bitfinex analysts had published that same day for everyone who bought bitcoin through U.S. spot exchange-traded funds. That timing — the cost basis report landing just hours before the price fell under it — turned an ordinary pullback into a test of whether ETF demand can hold up under pressure.
The two sessions of ETF buying that had carried bitcoin‘s rally into Wednesday are now sitting underwater. U.S. spot bitcoin ETFs pulled in $999.0 million on Monday and another $714.7 million on Tuesday, according to Farside Investors. Bitfinex noted that Monday’s inflow was the largest single-day figure since October 6, 2025, when bitcoin hit its all-time high. Across four sessions ending Tuesday, the funds absorbed $2.31 billion — equivalent to roughly 27,900 BTC at each day’s average price. By Wednesday’s close, bitcoin had traded down through the price at which that money entered, leaving those positions in the red.
Bitfinex Analysts’ Market Interpretation
Bitfinex framed the pullback as a genuine test rather than a routine dip. “With the aggregate ETF cohort cost basis returning to breakeven near $86,000 for the first time since January, both demand engines are holding profitable positions simultaneously,” the firm’s analysts wrote in Bitfinex Alpha. They added: “The critical test will be whether both cohorts maintain continuous net buying above their respective cost basis. Structural bids that only activate below average entry function merely as downside support rather than driving sustained expansion.”
Bitfinex also laid out the on-chain signals it wants to see before calling this a bull market rather than a failed recovery: supply held in profit staying above 75% through the first correction, long-term holder SOPR climbing back above 1.0 while price holds, and continued ETF and corporate buying above their respective cost bases. Corporate treasuries offer a separate reference point — Bitfinex estimated that cohort’s average cost near $80,500, notably lower than that of the ETF investor base.
Broader Crypto Market and Funding Rate Signals
The sell-off wasn’t confined to bitcoin. Total crypto market value fell 2.27% to $2.96 trillion on $132.8 billion of trading volume, according to CoinGecko data, with bitcoin dominance at 57.2%. Bitcoin itself last changed hands at $84,365.05, down 2.1% over 24 hours but still up 11.5% over the past week, after swinging between $83,654.39 and $87,251.25. Ether slipped 2.9% to $2,671.94, XRP dropped 5.8% to $1.48, and Dogecoin and Hedera fell 8.3% and 9.9%, respectively.
Derivatives markets flashed a clear warning sign. On OKX, the perpetual funding rate for bitcoin swaps turned negative at –0.0022%, while the ether swap rate fell to -0.0012% — both with a premium of -0.00044. Negative funding means short positions are paying longs, and both perpetuals were trading below their index price. That’s a sharp reversal from Tuesday, when both readings were positive (0.00019% for bitcoin and 0.0031% for ether) on the same day The Defiant reported CME’s futures listing news.
DeFi and Stablecoin Metrics Hold Steadier
Decentralized finance felt the same downward pull, though less severely. Total value locked across DeFi protocols stood at $94.55 billion, down 1.89% over 24 hours, according to DefiLlama. Stablecoin supply proved far more resilient, slipping just 0.06% on the day to $306.56 billion — still up 0.72% over the past week and 1.17% over 30 days, a sign that capital hadn’t fully exited the ecosystem even as risk assets sold off.
Market Sentiment and Traditional Asset Correlations
Sentiment cooled but hadn’t flipped bearish. The Crypto Fear & Greed Index, tracked by Alternative.me, dropped from 78 on Tuesday to 71 on Wednesday — still squarely in “greed” territory and well above the 51 reading recorded just a week earlier. Because the index only updates once daily at 00:00 UTC, Wednesday’s price action itself hadn’t yet been folded into that number, meaning the gauge may understate how quickly the mood shifted intraday.
U.S. Equities and Gold Retreat Alongside Crypto
The correlation with traditional markets was hard to miss. The S&P 500 closed at 7,706.03, down 0.75% from Tuesday’s 7,764.64, while the Nasdaq Composite fell 1.13% to 26,936.04. Gold wasn’t spared either — front-month Comex futures dropped 1.30% to $4,319.60 an ounce after trading between $4,311.20 and $4,407.50. Treasury yields ticked up slightly, with the CBOE 10-year index at 4.99% against Tuesday’s 4.968%. On Polymarket, traders priced a quarter-point rate increase at the late-October Federal Open Market Committee meeting at 53.5%, versus 45.5% for no change — figures barely moved from the day before.
CME’s Upcoming Futures Listings and Altcoin Moves
CME Group’s plan to expand its crypto derivatives lineup added a fresh layer of volatility to two specific tokens. The exchange said Tuesday it will list Bitcoin Cash and Uniswap futures on October 19, pending regulatory review, sized at 250 BCH and 10,000 UNI per contract, with micro contracts set at 25 BCH and 1,000 UNI. Neither the SEC nor the CFTC had published anything dated Wednesday addressing the listings, and CME hadn’t posted updated contract specifications since the initial announcement.
Uniswap Gives Back Its CME Bump, Bitcoin SV Holds Firm
Uniswap’s price action told a cautionary story about how fast speculative gains can unwind. UNI opened the UTC day at $10.2093, briefly touched $10.9339, then collapsed to $9.1490 — a 10.4% decline that wiped out the entire spike triggered by Tuesday’s CME announcement, leaving it just 1.7% above where it had traded before the news broke. Bitcoin Cash fared better, slipping only 1.2% to $337.59 after touching $365.91, and remains up 54.7% over the past week. Bitcoin SV, which forked from Bitcoin Cash in 2018 and wasn’t even named in CME’s release, still climbed 4.7% to a $448 million market value, up 42.1% for the week — a reminder that speculative interest sometimes spills into tokens adjacent to the actual news.
Elsewhere, the broader altcoin tape leaned negative. XRP and Dogecoin posted losses, while smaller-cap tokens like Bitway and Derive posted double-digit gains, underscoring how uneven the session was beneath the market-wide decline.
What This Signals for the Market
This pullback lands at a genuinely sensitive moment. Bitfinex’s own framing makes clear why: for the first time since January, both the ETF cohort and corporate treasury buyers were sitting on profitable positions at the same time. A break below the ETF cost basis puts that alignment at risk, and it raises the stakes for the next round of ETF flow data — if inflows resume above $86,000, it would support the idea that demand is durable rather than opportunistic. If flows stay weak or reverse into outflows, the bitcoin price decline could extend, particularly with funding rates already negative and shorts currently getting paid.
The CME futures episode adds a separate but related lesson. Uniswap’s full round-trip — up sharply on the listing news, then straight back down — shows how quickly speculative positioning around new derivatives products can unwind once the initial reaction fades. With Bitcoin Cash and Uniswap futures still pending regulatory review ahead of the October 19 target date, more volatility in both tokens looks plausible between now and the listing.
FAQ
Why did Bitcoin’s price fall below the ETF average cost basis?
Bitcoin traded below the $86,000 average cost basis of U.S. spot ETFs as inflows slowed and broader crypto market prices declined on September 23, 2026.
What does a negative funding rate on OKX indicate?
Negative funding rates mean short positions pay longs, reflecting bearish pressure on bitcoin and ether swaps.
What is the significance of CME Group’s upcoming futures listings?
CME Group plans to list Bitcoin Cash and Uniswap futures on October 19, pending regulatory approval, potentially impacting trading volumes and market sentiment.
How did traditional markets perform alongside crypto on September 23, 2026?
U.S. equities declined with the S&P 500 down 0.75%, Nasdaq down 1.13%, and gold fell 1.30%, mirroring the crypto market downturn.
Article produced with the assistance of artificial intelligence and reviewed by the editorial team.

Finley Benson is a tech-savvy writer with a background in blockchain development, Finley explores the latest innovations in Web3, DeFi, and smart contract technologies. His articles blend technical depth with real-world applications.